Your guide to understanding data-driven visualization tools.
How to find the best data-driven visualization tools for your business.
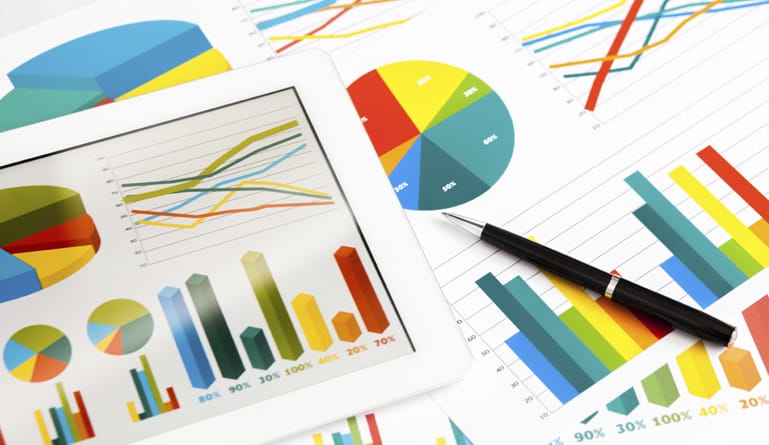
If a picture is worth a thousand words, what does your data say? Is there a tool that can help it say more? When it comes to interpretating and understanding data, a visual tool can help everyone – from visual learners to people who want to save time reading through long data sets. Here are some of the benefits of data-driven visualization tools, plus the best ones for your business to use.
The Benefits of Big Data Visualization Tools
How can visualization tools help improve your business?
- Helps to keep data representation interesting
- Makes data more compelling
- Organizes data in an appealing and understandable way
- Can be a more appropriate way to discuss and see data in presentations and other settings
- Makes data easier to digest and understand
- Ensures data is faster and easier to sort through and create meaning from
- Deeper understanding of trends
Visual tools are helpful for offering another way to present data – while big data AI can interpret and analyze data from huge data sets, most people can’t immediately understand relationships and meaning from data from raw data alone. Charts, graphs, and other visuals offer individuals a way to understand large data sets. Visual representations are also very helpful when it comes to comparing data sets, either to track progress or changes.
Visual representation has many benefits and uses and finding the best tool for your business to create charts, graphs, and other corresponding visual pieces for data can be both important and helpful for making meaning of your data, both internally and in external presentations, whether with clients or customers.
The Best Data-Driven Visualization Tools
Finding the best tool for your business will depend on what your business needs to do with its data and is trying to accomplish through visual representation. Here are some solutions to consider in your data visualization tools comparison.
- Chartjs: This open source visualization solution is perfect for businesses who need simple and straightforward visualizations for their data.
- Google Charts: Google Charts is a highly interactive and customizable data-driven visual representation solution. It works across desktop browsers, but also with most Android and iPhone internet software.
- Leaflet: Sometimes the data companies work with is geographical, and the best visual representation tool is a map. Leaflet is a good solution for organization geographical or topographical data.
- Infogram: This free data visualization tool helps users create online charts and infographics. A paid option unlocks over 200 features, including maps and additional icons.
- Plotly: This web-based tool creates graphs and charts that make data analysis easier. It also creates professional looking results for use across the web and other areas.
- Jupyter: This open-source data visualization tool is a good option for processing larger amounts of data and is also easily shared and modified among users.
Data interpretation and representation can have a huge impact on decision making for the people in your business or customers who are using your business. Data visualization tools make it easier for any user to understand data, and therefore make more informed decisions. Has your business tried any of these data-driven visualization tools?